

Active vs. Passive and an Elephant in the Room!
As part of its Mutual Fund Analytics and Advisory, Multi-Act covers nearly 300+ equity mutual funds in India on a regular basis and try to keep an active pulse on underlying factors therein, which drives the eventual returns, vis. Quality, Momentum and Valuations as well as any broad shifts in the trends and structure of the MF Industry.
As has been the case globally, there has been a lot of talk about passive vs active investing in recent times in India as well. Investors/Clients/Advisors also has this pertinent question in mind with issues surrounding returns, costs, timing, distribution fees etc. affecting them in various ways.

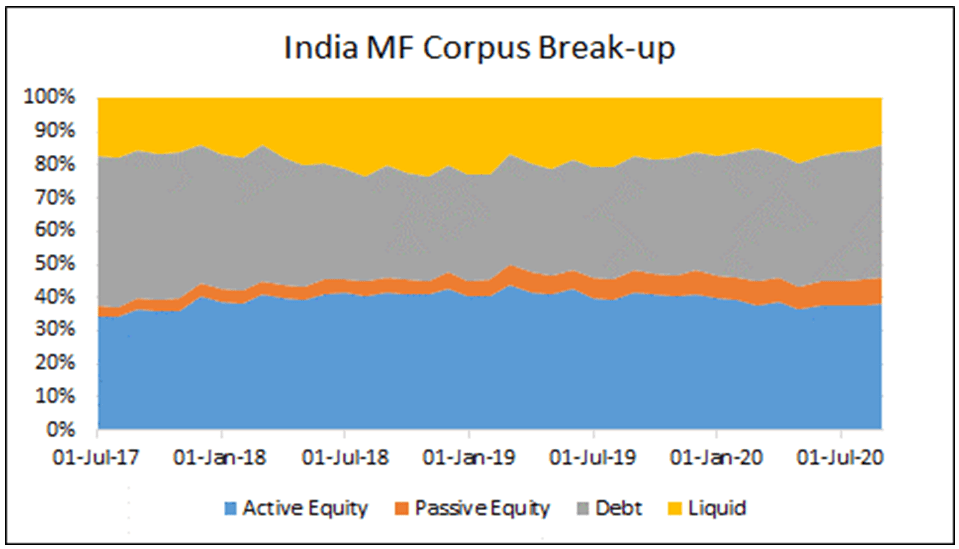
Above table provides the break-up of entire Indian Mutual Fund industry.
Let us zoom in on equity portion of it:
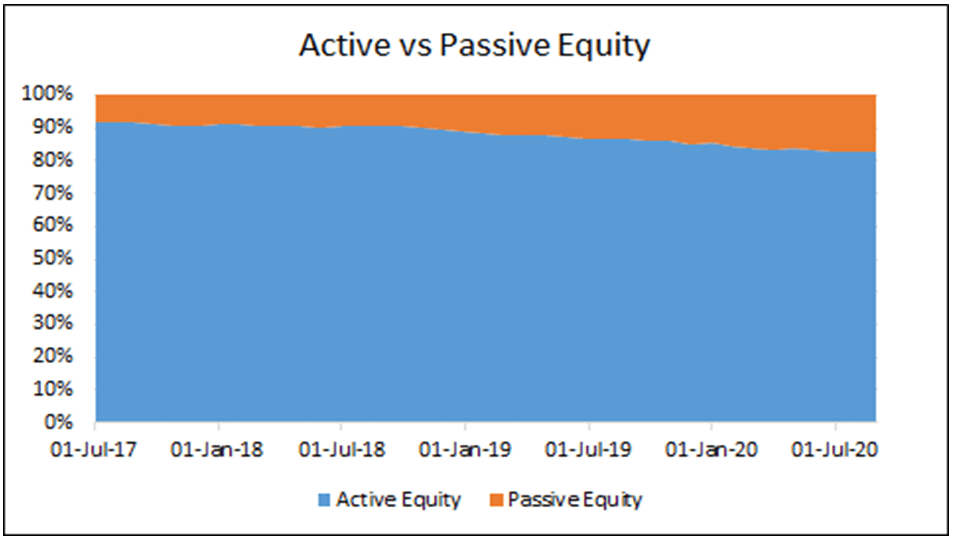

Passive instruments are not accounting for even 20% of equity market currently and even lower proportion of the entire Indian MF Industry. However, these charts fail to put emphasis on the recent shift from Active to Passive:

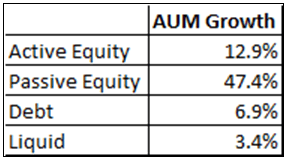
Above table captures the growth rate over last 3 years. Corpus of Passive Funds has more than tripled in last 3 years. Within that, Large cap category has seen the most substantial proliferation of rise in number and AUMs of ETFs.

Undeniably, there is shift in the large cap AUM composition towards Passive, however, it also needs to be seen in the context of increasing contribution of EPFO, which is a mandate driven shift/push, and not necessarily owing to investor preference per se (annexure 1).
Then the next question that arises is, have Passive Funds justified this shift and outperformed their Active peers?
To answer that, we have tried to compare the performance metrics for passive funds in large cap category (proxy: Nifty 50 and Sensex ETFs) with that of active funds in large cap category.

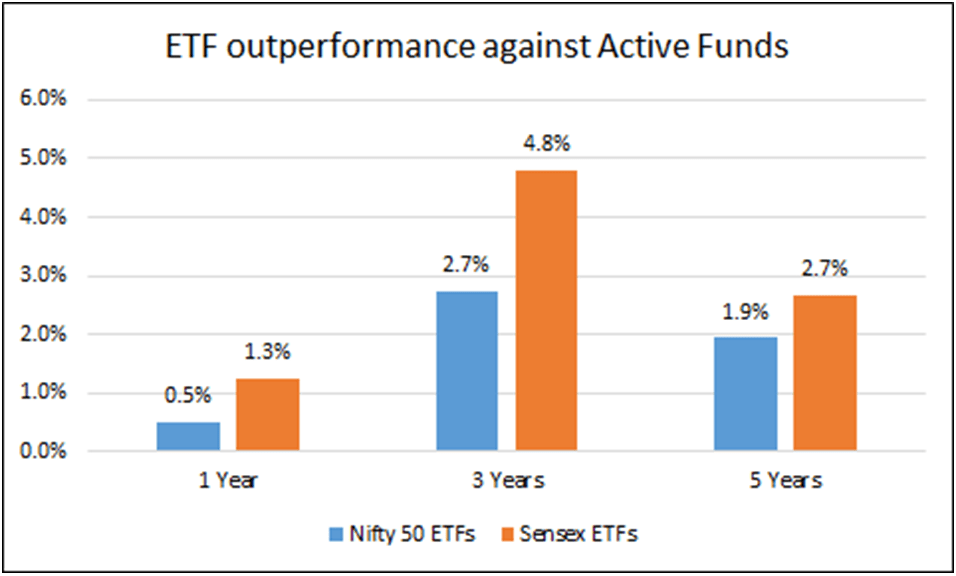
As can be seen above, ETFs have outperformed active large cap funds across different time frames.
For calculating above outperformance, we have compared median performance of large cap open-ended funds with the median of ETF performances.
Decline in outperformance margin in last 1 year could possibly be because of ability of active funds to take cash calls (during recent market fall) and the ability to invest in stocks other than top 50 or 30.
Interestingly, margin of outperformance between the two segments is very close to differences in their expense ratios: ETFs = ~0.1%, Active Funds = ~2.25%
Thus, there is increasing evidence of inability of active large cap funds as an aggregate to beat the passive investing on a consistent basis and thus, any large cap mutual fund allocations in the portfolios should be done keeping that into account.
Elephant in the Room:
However, upon deeper and pertinent analysis, one more factor emerges that could significantly affect such point-to-point returns, is exposure to Reliance Industries stock (thanks to buzz surrounding Reliance Jio!):
When a stock like RIL has become such a huge chunk of the index (currently, ~13.8%), active funds have tended to remain under-weight most of the times. Noteworthy here is the fact that regulations in India have generally capped maximum exposure to a stock in case of active mutual funds to 10%.
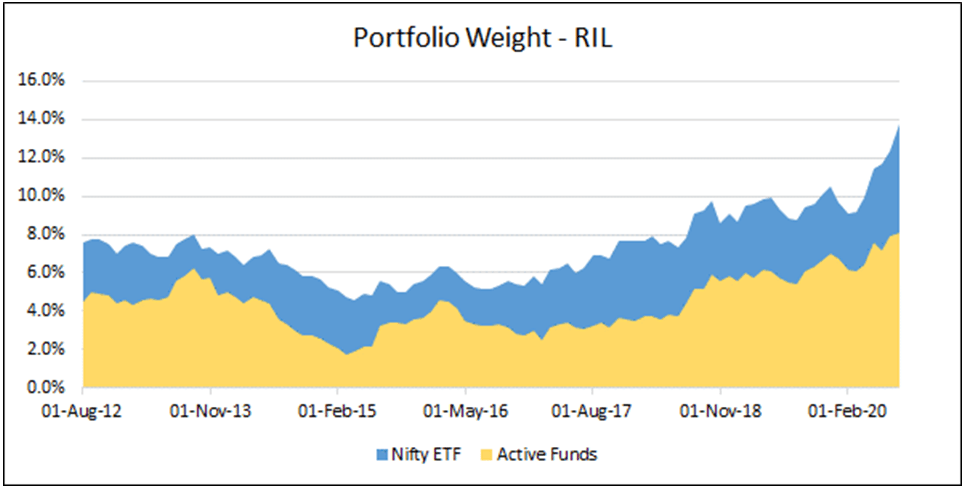

That has had significant impact on the performance comparison of ETFs vs. Active Funds. It is worth remembering here that ETFs by design don’t/can’t take such active under exposure to any such stock and being market cap weighted, they have benefitted from recent momentum/bull run in the RIL stock.
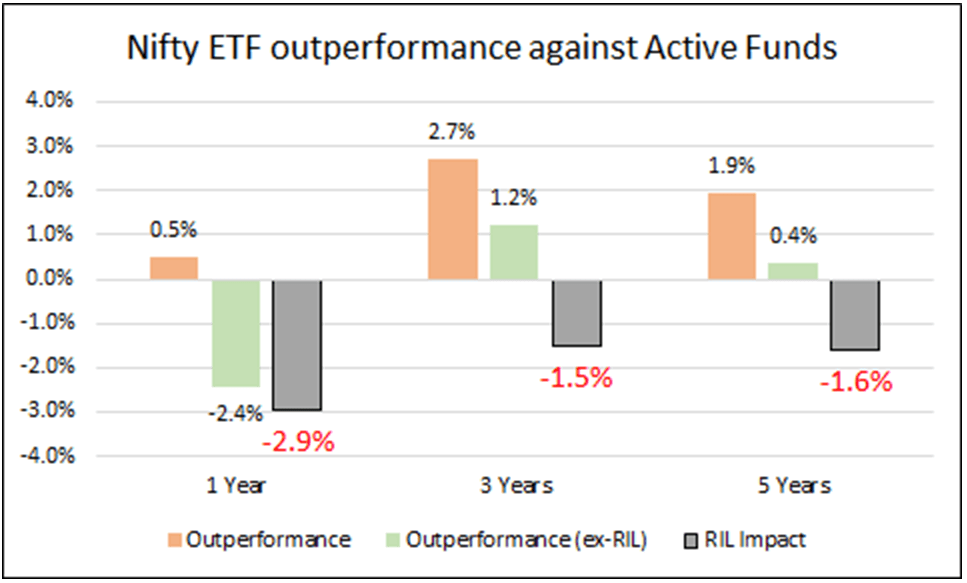

Above table highlights the performance impact of RIL weight differential in ETFs vs that of Actively managed Large Cap Funds.
This goes on to highlight another broader issue which markets globally are observing and that is of dichotomy of split markets wherein few top heavy stocks in the indices have been carrying the whole market momentum (while the other part drags and lags) and a circuitous loop of passive strategies feeding and benefitting from the same continues unabetted (well as they say, till the time it continues, until one fine day when it doesn’t..…!!), strengthening the case for rational investors to be ever vigilant of market trends and underlying strictures.
Rational Investing, Happy Investing!
________________________________________________________________________________________________
Annexure:
1. Since Aug 2015, EPFO has been investing in equity instruments through large cap ETFs, CPSEs and Bharat 22. Initially, EPFO used to invest 5% of its investible deposits in equity, which increased to 10% in 2016-17, and 15% from 2017-18 onwards.
As per EPFO website, its portfolio managers are State Bank of India (35%), ICICI Securities Primary Dealership (20%), Reliance Capital Asset Management (17.5%), HSBC Asset Management (17.5%) and UTI Asset Management (10%).
If we consider that all the corpus in SBI, ICICI and Nippon passive funds is from EPFO, its contribution in total passive funds could be in the range of 70% to 75% over time. Numbers available from EPFO annual report (2017-18) and some news articles also suggest EPFO contribution closer to 75% of large cap AUMs.
2. ETF comparison with Nifty 50 Equal Weight Total Returns:
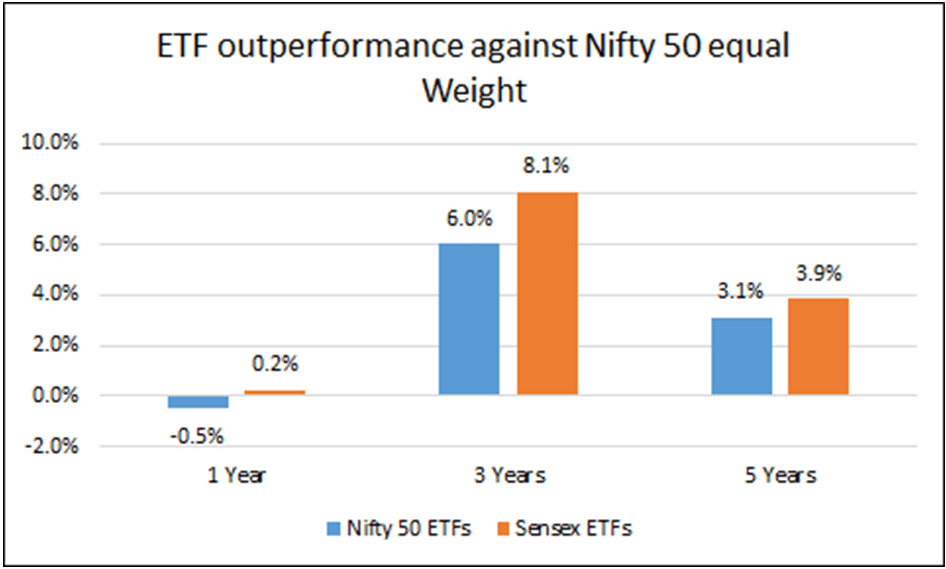

When we compare ETF performance with Nifty 50 Equal Weight index, the margin of outperformance increases significantly barring last 1 year (when ETF performance is at par with the index).
________________________________________________________________________________
No Comments